Image

Previous Great Lakes content

Previous regional content in the U.S. Climate Resilience Toolkit was developed by interagency teams of subject matter experts. To keep science represented in the Toolkit current, we now point to the most recent National Climate Assessment for each region. We've preserved our previous content below.

Read Full Summary
Map of the Great Lakes region

The Great Lakes region includes all or portions of eight U.S. states—Minnesota, Wisconsin, Michigan, Indiana, Illinois, and Ohio in their entirety, plus the Great Lakes watershed areas of Pennsylvania and New York—as well as the province of Ontario, Canada. The region straddles U.S. regions typically described as the Midwest and the Northeast.

While Ontario is generally included in the definition of the Great Lakes region, this website focuses on climate resilience in the United States and is intended to serve the U.S. portion of the Great Lakes region.

The region is home to approximately 23 million people on the U.S. side of the Great Lakes Basin, and contains agricultural lands, forests, urban areas (including Buffalo, Chicago, Cleveland, Detroit, Milwaukee, and Rochester), diverse shorelines, and the Great Lakes themselves—the region’s economic backbone.

Scenes from the Great Lakes: Agriculture, Forests, Cities, Shorelines, and the Lakes Themselves

The Great Lakes region includes agricultural lands, forests, urban areas, diverse shorelines, and—of course—the Great Lakes themselves

Together, the Great Lakes make up the largest freshwater system on Earth, containing 84 percent of North America’s fresh surface water. The lakes are a vital resource for water supply, transportation, recreation, and power generation, among other uses.

In recent decades, the region has experienced substantial shifts in populations, socioeconomics, air and water pollution, and land use. Both the built and the natural environment display potential vulnerabilities to climate variability and change.

Regional impacts of a changing climate

Climate change will tend to amplify existing risks that impact people, ecosystems, and infrastructure. The effects of increased heat stress, flooding, drought, and late spring freezes may be magnified by other changes, such as a change in the prevalence of diseases and pests, increased competition from invasive species, land use change, an increase in air pollution, and economic shocks from extreme weather events. These impacts are particularly concerning to the region because a major component of the regional economy relies on the fisheries, recreation, tourism, and commerce generated by the Great Lakes and the northern forests.

Maps showing observed changes in temperatures across the United States

Temperature

Temperatures in the Great Lakes region have been rising over the past several decades. The average temperature in northern portions of the region has increased by more than 1.5°F compared to the 1901–1960 average, and the rate of warming has increased in the last decade. Temperatures in the winter and at night are warming faster than in other seasons or in the daytime.

The map on the right shows observed changes in annual, winter, and summer temperature in the United States (°F). Changes are the difference between the average for present-day (1986–2016) and the average for the first half of the last century (1901–1960 for the contiguous United States, 1925–1960 for Alaska and Hawai‘i).

The amount of future warming for the region will depend on the amount of heat-trapping gases (emissions from burning fossil fuels) in the atmosphere. Regional projections for the middle of the 21st century suggest warming of 3.5–4.5°F above the 20th century average in a lower emissions scenario and 5.5–6.5°F in a higher emissions scenario. By the end of the century, projections indicate warming from approximately 5.5–6.5°F (lower emissions scenario) to 7.5–9.5°F (higher emissions scenario).

Map of the United States divided into regions showing percentage change on heavy precipitation between 1958 and 2016

Precipitation

Annual precipitation in the Great Lakes region has generally increased over the past several decades. Some of this increase is attributable to increases in the intensity and duration of the heaviest rainfalls—a trend that is projected to continue into the future. Observations have not documented any change in drought duration in the region (or the larger Midwest region) over the past century.

Model projections for future precipitation are less certain than those for temperatures. By late this century, under a higher emissions scenario, models project average winter and spring precipitation to increase 10 to 20 percent, relative to 1970–2000; under the same conditions, changes in summer and fall precipitation are not projected to be larger than natural variations. Some regional climate model projections using the same emissions scenarios also project increased spring precipitation and decreased summer precipitation, though these expected patterns are not as significantly altered as they are to the south of the Great Lakes. Increases in the frequency and intensity of extreme precipitation are projected across the Great Lakes region.

Satellite view of clouds streaming off the Great Lakes

Lake Effect Snow

Satellite image of lake-effect snow occurring over the Great Lakes region. Lake-effect snow occurs when cold dry air passes over a large, warm lake and picks up moisture and heat. Clouds build overhead and eventually develop into snow showers as they move downwind. In this image, the wind is moving from the northwest to the southeast. It picks up moisture from Lakes Nipigon, Superior, and Michigan and deposits it as snow further downwind.

In the snow belts of the Great Lakes, average lake-effect snowfall activity has increased since the early twentieth century for Lakes Superior, Michigan-Huron, and Erie. Individual studies for Lakes Michigan and Ontario, however, indicate that this increase has not been continuous—in both cases, upward trends were observed until the 1970s and early 1980s; since then, lake-effect snowfall has decreased in these regions.

Ice cover extent and lake water temperatures are the main controls on lake-effect snow that falls downwind of the Great Lakes. As the region warms and ice cover diminishes in winter, models predict that more lake-effect snow will occur. The predictions change once lake temperatures rise to a point when much of what now falls as snow will instead fall as rain.

The Michigan Department of Transportation has noted that an increase in lake-effect snows means that existing models used for snow and ice removal procedures are no longer reliable. Changing conditions will require better monitoring, new models, and improvements in roadway condition detection systems.

The preceding text is excerpted and abridged from the Synthesis of the Third National Climate Assessment for the Great Lakes Region, the Climate Science Special Report: Fourth National Climate Assessment, Volume I (Section 7.1.2), and the U.S. National Climate Assessment: Climate Change Impacts in the United States (Chapter 5, Transportation).


Increased risks to the Great Lakes

The Great Lakes themselves influence regional climate conditions and impact climate variability and change. They also influence daily weather by (1) moderating maximum and minimum temperatures, (2) increasing cloud cover and precipitation over and just downwind of the lakes during winter, and (3) decreasing summertime convective clouds and rainfall over the lakes. Consistent with observed changes in regional climate, the Great Lakes show a trend toward higher water temperatures and smaller average winter ice extents.

Maps showing the rate of change of summer surface water temperature in the Great Lakes

Water temperatures

Summer surface water temperature in Lake Huron increased 5.2°F between 1968 and 2002. Over the same period, summer surface water temperature in Lake Superior increased 4.5°F, twice the rate of increase in air temperature. These lake surface temperatures are projected to rise by as much as 7°F by 2050 and 12.1°F by 2100.

The greatest rates of temperature increase across the Great Lakes  occurred in deeper water, with smaller increases occurring near shorelines. Summer surface water temperature in Lake Huron increased 5.2°F between 1968 and 2002. Over the same period, summer surface water temperature in Lake Superior increased 4.5°F, twice the rate of increase in air temperature. These lake surface temperatures are projected to rise by as much as 7°F by 2050 and 12.1°F by 2100.

Higher temperatures, increased precipitation, and lengthened growing seasons are likely to result in increased production of blue-green and toxic algae in the lakes. Blooms of these algae can harm fish, water quality, habitats, and aesthetics—and could worsen the impact of invasive species.

Maps showing the duration of seasonal ice cover in the Great Lakes

Ice Coverage

Although there is substantial variability from year to year, the average annual maximum ice coverage in the Great Lakes was just 40 percent between 2003 and 2012—smaller than the average 52 percent coverage from 1962 to 2013. For comparison, maximum ice coverage averaged 67 percent during the 1970s, a decade that included several extremely cold winters. From 1973 to 2010, ice cover on the Great Lakes declined an average of 71 percent, although it was high in the winters of 2014 and 2015. Less ice, coupled with more frequent and intense storms, leaves shores vulnerable to erosion and flooding and could harm property and fish habitat.

The duration of seasonal ice cover decreased in most areas of the Great Lakes between 1973 and 2013. The map shows the rate of change in ice cover duration. The greatest rate of decrease in seasonal ice cover duration is seen near shorelines, with smaller rates occurring in the deeper central parts of Lakes Michigan and Ontario, which rarely have ice cover.

Reduced ice cover also has the potential to lengthen the shipping season. The navigation season increased by an average of eight days between 1994 and 2011: extra days for shipping can benefit commerce, but navigable conditions can also increase shoreline scouring and bring in more invasive species.

The cargo freighter SS Arthur M. Anderson

Lake levels and destratification

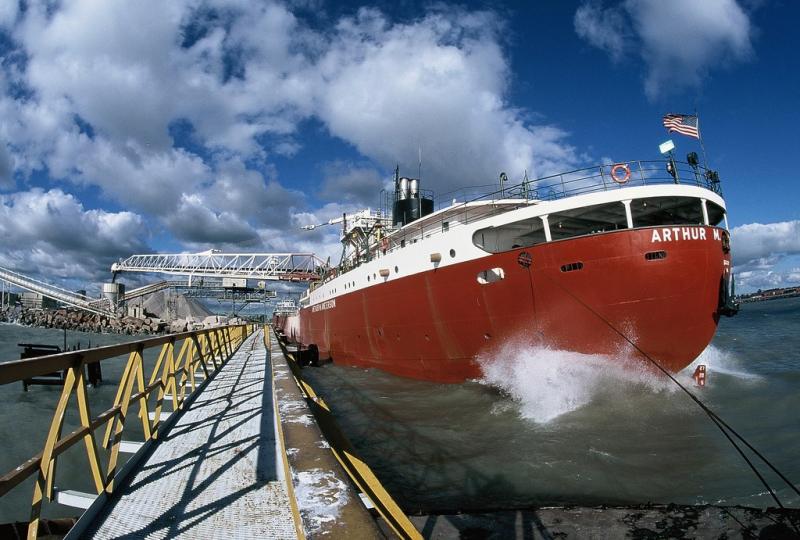
Water levels in the Great Lakes fluctuate naturally, and it is more likely than not that levels will decline with a changing climate. Changes in lake levels can influence the amount of cargo that can be carried through them on ships. On average, a 1,000-foot ship sinks one inch lower in the water for every 270 tons of cargo it carries. If a ship is currently limited by water depth, any lowering of lake levels will result in a reduction in the amount of cargo it can transport to Great Lakes ports.

In addition, fluctuating lake levels influence how people use and interact with shorelines. During sustained low water periods, development marches closer to the lake, shorefront landowners “groom” emergent coastal wetlands, and increased navigational dredging is needed. When lake levels go up, erosion and flooding, particularly when coupled with storms, can threaten properties and public safety.

It’s unclear whether, or how much, a changing climate will affect lake levels in the future. Current estimates of lake level changes are uncertain; recent studies, along with a large spread in existing modeling results, indicate that projections of Great Lakes water levels represent evolving research and are still subject to considerable uncertainty.

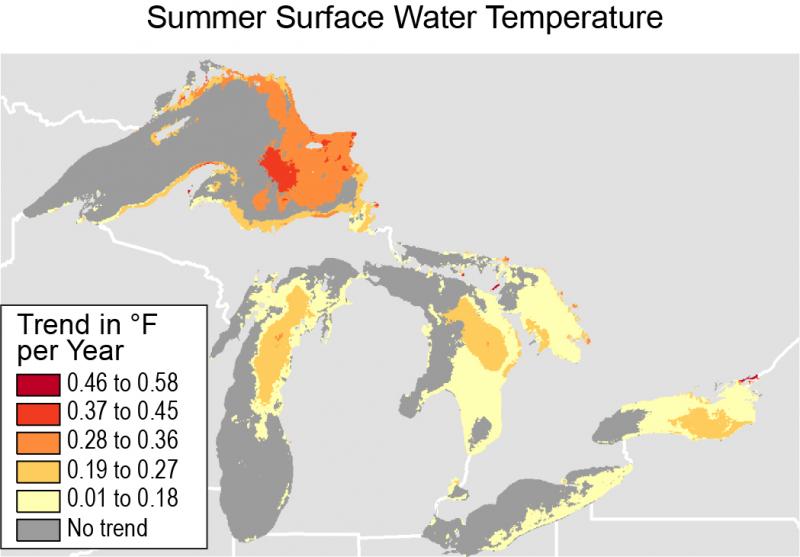
An important seasonal event for biological activity in the lakes is the turnover of water, or destratification. This has historically occurred twice a year: during the fall as water temperature drops below 39°F, the point at which freshwater attains its maximum density, and again in the spring, when water temperature rises above that threshold. The mixing that occurs during these times carries oxygen down from the surface and nutrients up from the bottom. Climate projections suggest that the overturn in spring, which triggers the start of the aquatic "growing season," will happen earlier and that the fall overturn will happen later. As the duration of the stratified period increases, the risk of impacts from low oxygen levels at depth and lack of nutrient at the surface increases, which can potentially lead to declines in species populations in both zones.  

Jennifer Day (NOAA), Team Lead
Joseph Clark (NOAA)
Beth Hall (Midwestern Regional Climate Center)
Jenna Jorns (Great Lakes Integrated Sciences + Assessments)
Doug Kluck (NOAA)
Sam Lashley (NOAA)
Judith Levan (NOAA)
Sarah Marquardt (NOAA)
Meredith Muth (NOAA)
Heather Stirratt (NOAA)
Rachael Taylor (NOAA)